Traces to logs correlation in AWS with Node.js


Introduction
I recently joined MakerX, and the first project I worked on was hosted in AWS using Fargate to run containers, CloudWatch for logs, and X-Ray for OpenTelemetry traces.
To make troubleshooting easier, we wanted to see how we could get correlation between traces and logs, or, in other words, how we could get log records when looking at individual traces.
Infrastructure setup
This section is important, as there are various ways of setting up traces to logs correlation, and the best way might vary depending on your infrastructure.
Here's a simplified architecture diagram:
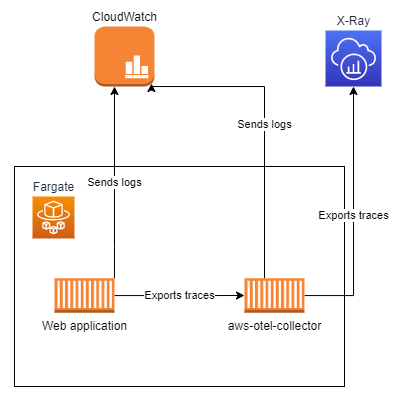
Some key points:
aws-otel-collectoris the AWS Distro for OpenTelemetry Collector.- Our web application container was configured with the OpenTelemetry SDK for Node.js to instrument the application, and export the traces to
aws-otel-collector. - Both containers were configured to send their logs to CloudWatch.
The situation allowed us to query logs with Logs Insights and see traces through X-Ray, but we couldn't see which logs were associated with a trace, at least not easily.
Required configuration
In order for the AWS console to show logs related to a trace, two things must be in place.
Trace ID injection in logs
This is documented in the X-Ray SDK for Java section, and indicates that log entries must contain an AWS-XRAY-TRACE-ID property which value is <trace-id>@<span-id>.
Two things worth noting here are that we're running a Node.js application and are not using the X-Ray SDK, but the OpenTelemetry SDK, which is provider-agnostic.
As we use the winston npm package for logging, and the associated @opentelemetry/instrumentation-winston package for instrumentation, the implementation looked like this:
const instrumentations = [
  getNodeAutoInstrumentations({
    // Other instrumentations omitted for brevity
    '@opentelemetry/instrumentation-winston': {
      logHook: (_, record) => {
        if (typeof record.trace_id === 'string' && typeof record.span_id === 'string') {
          record.aws_xray_trace_id = `${convertToX-RayTraceIdFormat(record.trace_id)}@${record.span_id}`
        }
      },
    },
  }),
]

const convertToX-RayTraceIdFormat = (traceId: string) => {
  return `1-${traceId.substring(0, 8)}-${traceId.substring(8)}`
}
The winston instrumentation gives us a hook to run code before log entries are published, so we use this opportunity to look at the current record and enrich it with a property as per the documentation.
The convertToX-RayTraceIdFormat is needed because the trace ID we get is an OpenTelemetry-standard trace ID (e.g. 646300dfd882adb0970ef7bdefe13d40) but X-Ray needs it in a specific format (e.g. 1-646300df-d882adb0970ef7bdefe13d40@9189f6cf91755be7).
Log group injection in traces
I couldn't find official documentation for this, but stumbled on a GitHub issue where it's mentioned that the traces sent to X-Ray must contain information about the CloudWatch log groups where associated logs are, so the AWS console can query them.
Traces must contain an aws section that resembles the below:
{
  // Rest of the trace omitted for brevity
  "aws": {
    "cloudwatch_logs": [
      {
        "log_group": "<log-group-name>",
        "arn": "arn:aws:logs:<region>:<account-id>:log-group:<log-group-name>:*"
      }
    ]
  }
}
We relied on the AWS Distro for OpenTelemetry Collector container for this, as it has support for enriching traces through environment variables before exporting them to AWS, see the documentation at https://aws-otel.github.io/docs/getting-started/x-ray#otel-span-cw-logs-metadata-translation.
Given we used CDK for infrastructure provisioning, it was simple to add this environment variable, referencing the relevant log group:
const otelSidecarContainer = webTaskDefinition.addContainer('otel-sidecar', {
  containerName: `${id}-otel-sidecar`,
  image: props.otelSidecarImage,
  logging: ecs.LogDriver.awsLogs({ streamPrefix: 'otel', logGroup: logGroup }),
  environment: {
    OTEL_RESOURCE_ATTRIBUTES: `aws.log.group.arns=${logGroup.logGroupArn}`,
  },
})
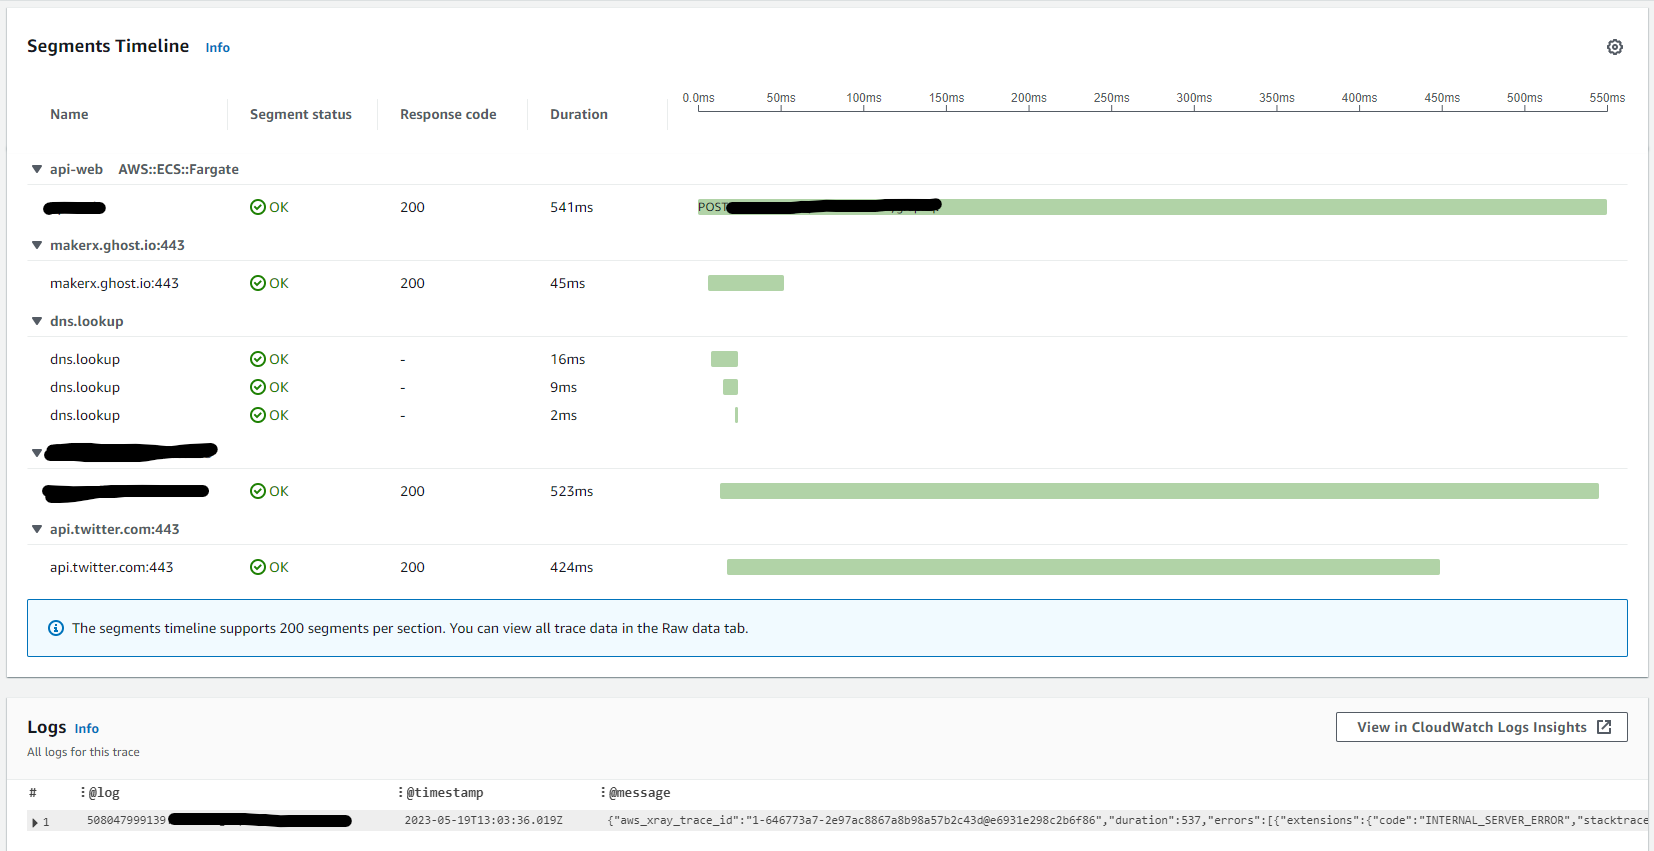
Result
When inspecting individual X-Ray traces, we now get associated logs, which gives us additional insight into what happened during a specific HTTP request.